Power distribution reliability is measured not only by how often outages happen, but also by how long customers remain without power. That is why utilities track SAIDI and SAIFI as key reliability indicators. Improving these metrics requires better visibility across the network, faster fault location, and more efficient restoration workflows.
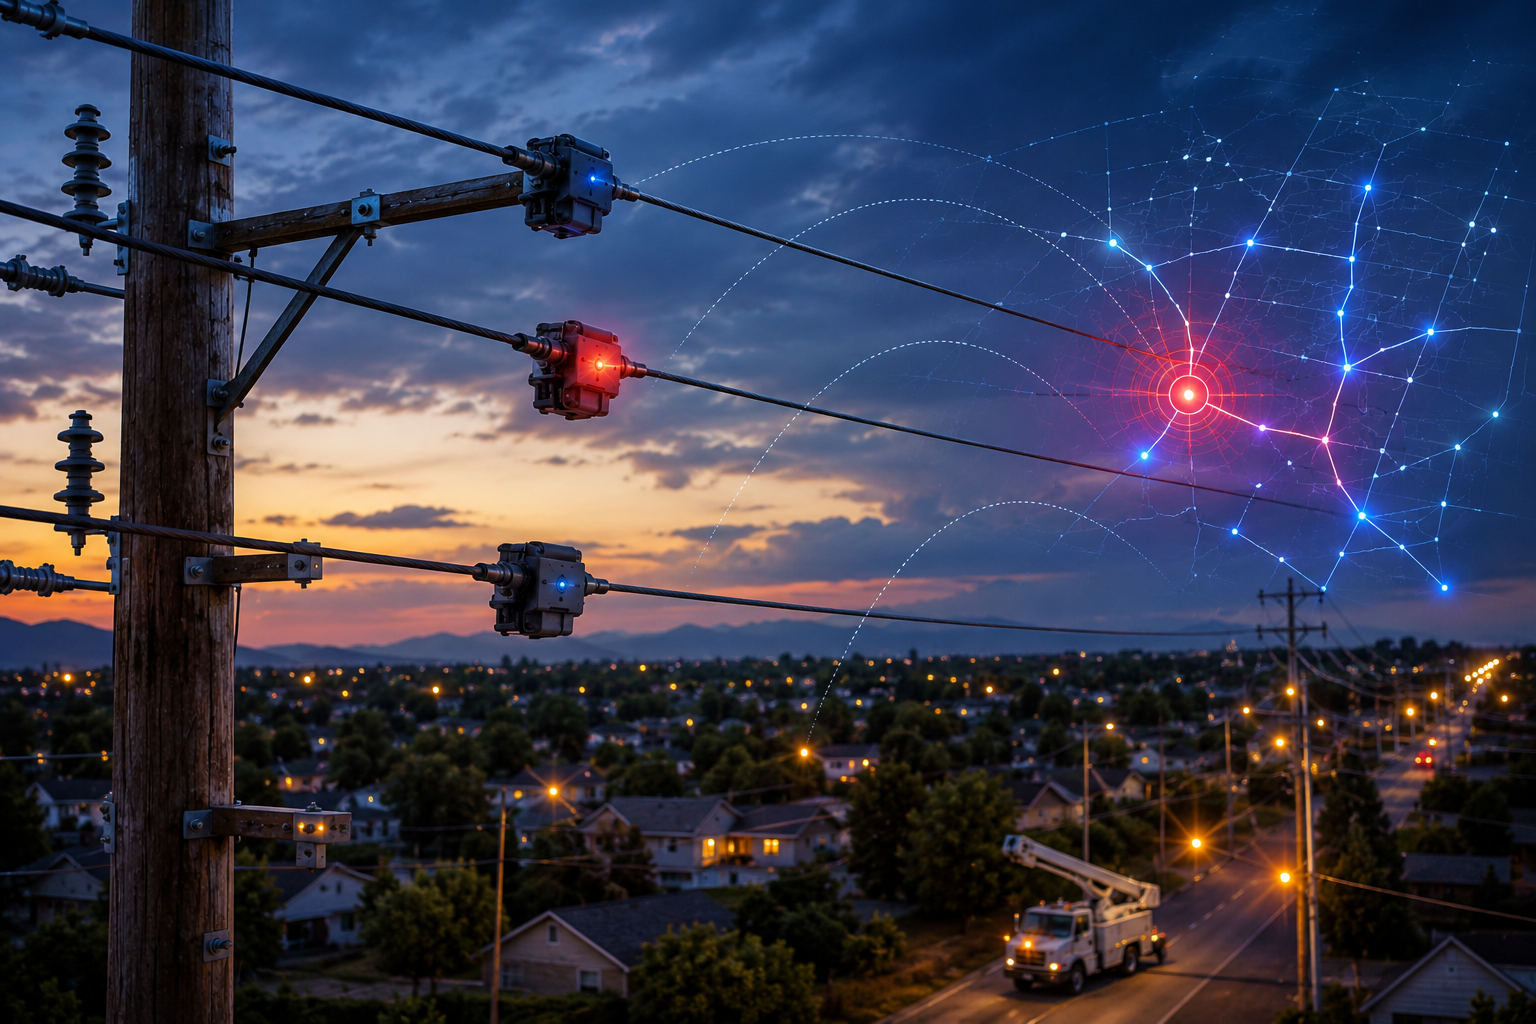
Fault indicators, including overhead fault indicators, faulted circuit indicators, line fault sensors, and line fault indicators, help utilities identify where a fault has passed through the network. This information can shorten the search process, support faster crew dispatch, and improve outage management.
Key Point
Fault indicators usually have the strongest direct effect on outage duration. They help improve SAIDI by reducing the time needed to locate faults and restore service. Their effect on SAIFI is usually indirect and depends on how they are combined with switching, sectionalizing, automation, and reliability planning.
Understanding SAIDI and SAIFI
SAIDI stands for System Average Interruption Duration Index. It shows the average outage duration experienced by each customer over a defined period, usually one year. In simple terms, SAIDI answers the question: “How long was the average customer without power?”
SAIFI stands for System Average Interruption Frequency Index. It shows how many sustained interruptions the average customer experienced during the same period. In simple terms, SAIFI answers the question: “How often was the average customer interrupted?”
| Reliability Metric | What It Measures | How Fault Indicators Help |
|---|---|---|
| SAIDI | Average outage duration per customer | Supports faster fault location, faster crew dispatch, and shorter restoration time |
| SAIFI | Average number of sustained interruptions per customer | Can support better sectionalizing, automation planning, and reduction of repeated interruptions when used with other reliability measures |
| CAIDI | Average restoration time for interrupted customers | Can improve when crews reach the faulted section faster and restoration steps are better coordinated |
For utilities, these metrics are more than reporting numbers. They show how reliable the distribution network feels to customers. A feeder with long search times after faults can increase SAIDI even if the number of faults is not very high. A feeder with frequent recurring faults can increase SAIFI even if each event is restored quickly.
What Fault Indicators Do
A fault indicator is a device that gives a visual or remote signal when a fault current has passed through a point on the electrical network. In overhead distribution systems, an overhead line fault indicator or line fault indicator may be installed on the conductor, pole, or near a switching point. In underground systems, faulted circuit indicators are often used in cabinets, vaults, or cable compartments.
The purpose is not to replace circuit breakers, protection relays, reclosers, or fuses. Protection equipment interrupts or isolates faults. Fault indicators provide operational information that helps operators and crews understand where the fault is likely located.
Fault Passage Indication
The device shows whether fault current has passed through a specific point on the feeder.
Faster Search Area Reduction
Operators can narrow the likely faulted section instead of sending crews to patrol the entire line.
Remote Alerts
Communication-enabled indicators can send fault status to a control center, SCADA, OMS, or DMS.
How Fault Indicators Help Improve SAIDI
SAIDI is strongly influenced by how long it takes to restore power. In many overhead distribution networks, a significant part of restoration time is spent finding the faulted section. This is especially true on long rural feeders, forested lines, mountain routes, and areas with difficult road access.
A line fault sensor or line fault indicator can reduce this delay by showing where the fault current did or did not pass. When several devices are installed along a feeder, operators can compare their status and identify a smaller section for inspection.
1. Less time spent on line patrol
Without fault indicators, crews may need to inspect many kilometers of line before finding the problem. With fault passage data, the search zone becomes smaller. This can reduce driving time, inspection time, and the number of unnecessary field checks.
2. Better crew dispatch
Dispatchers can send crews closer to the suspected faulted area. Instead of starting from the substation and working along the entire feeder, the repair team can begin where the data points to a likely fault location.
3. Faster switching decisions
When operators know which section is likely faulted, they can make more informed switching decisions. Healthy sections may be restored sooner if the network has suitable switching points and operating procedures.
4. More accurate restoration estimates
Better fault location improves communication between control centers, crews, and customer service teams. When the utility has a clearer view of the problem area, restoration estimates can become more realistic.
Practical Result
The main SAIDI benefit comes from reducing the time between feeder trip, fault location, crew arrival, isolation, repair, and service restoration.
How Fault Indicators Can Support SAIFI Improvement
SAIFI measures interruption frequency, so fault indicators do not reduce SAIFI in the same direct way they can reduce SAIDI. A fault indicator does not stop a tree from touching a line, prevent lightning, or remove aging equipment. However, it can support SAIFI improvement when it is part of a broader reliability program.
Recurring fault analysis
Fault indicator data helps utilities identify feeder sections with repeated fault activity. If the same section frequently shows fault passage, the utility can prioritize vegetation management, insulation inspection, pole-line maintenance, or equipment replacement in that area.
Better sectionalizing strategy
When line fault indicators are used near switches, reclosers, or branch points, operators can better understand which parts of the network are affected by recurring events. This can support decisions about adding sectionalizers, changing protection settings, or improving feeder segmentation.
Support for automation
Fault indicators can support distribution automation and FLISR strategies when their data is integrated with switching devices and control systems. In this case, the utility may reduce the number of customers affected by some events, which can help reduce interruption frequency for customers outside the faulted section.
Important Distinction
Fault indicators alone usually do not eliminate the cause of interruptions. They support SAIFI improvement when their data leads to better planning, better sectionalizing, and fewer repeated customer interruptions over time.
Where to Install Line Fault Sensors
The value of fault indicators depends heavily on placement. A device installed at a poor location may provide limited operational value. A well-planned installation can divide a feeder into clear diagnostic zones and make fault location much faster.
| Installation Point | Why It Matters | Expected Operational Benefit |
|---|---|---|
| Feeder main line | Helps identify whether the fault is upstream or downstream of a major point | Faster section identification |
| Branch lines | Helps determine whether the fault is on the main feeder or a lateral branch | Reduced unnecessary patrols |
| Near switching devices | Supports safe and informed isolation and restoration decisions | Better switching coordination |
| Remote or hard-to-access areas | Provides visibility where manual inspection is slow or difficult | Shorter field search time |
| Known problem sections | Helps track recurring faults and confirm maintenance priorities | Better reliability planning |
Good placement should be based on feeder topology, historical outage data, customer density, switching points, vegetation exposure, and crew access routes. The goal is to make the network easier to diagnose during real outage conditions.
SCADA, OMS, and DMS Integration
Local visual indication is useful for field crews, but remote indication creates a stronger impact on outage response. When a fault indicator sends data to a control center, the utility can act before the crew reaches the line.
Integration with SCADA, outage management systems, and distribution management systems can improve the full restoration process.
SCADA
SCADA integration allows operators to see fault status and line events in near real time. This supports faster awareness and better operational decisions.
OMS
An outage management system can use fault indicator data together with customer calls, smart meter signals, feeder models, and switching status. This helps improve outage location and crew coordination.
DMS
A distribution management system can combine feeder topology, switching plans, protection data, and field device status. This supports more advanced restoration workflows and can help operators restore healthy sections faster.
Faster Awareness
Remote fault alerts reduce the delay between the event and the operator’s first action.
Better Decisions
Field data helps operators decide where to send crews and which sections to inspect first.
Cleaner Reporting
Event data can support reliability analysis, feeder performance reviews, and post-outage reports.
From Fault Event to Restoration
Fault indicators support reliability improvement because they fit directly into the outage response workflow.
- A fault occurs on an overhead or underground distribution line.
- Protection equipment operates and interrupts or isolates the fault according to the network design.
- Fault indicators show fault passage locally or send a remote alert to the utility system.
- Operators compare device status and identify the likely faulted section.
- Dispatchers send crews to a smaller, more accurate search area.
- Crews inspect, isolate, and repair the affected section.
- Service is restored to customers as soon as it is safe and technically possible.
Each saved minute in this workflow can reduce customer interruption duration, especially on feeders serving many customers.
How to Measure the Impact
Utilities should not evaluate fault indicators only by the number of devices installed. The real value is measured by operational improvement. A practical measurement plan should compare performance before and after deployment.
Useful performance indicators
- Average fault location time
- Average crew travel and patrol time
- Average restoration time for affected feeders
- Number of unnecessary patrols or wrong-section dispatches
- SAIDI and CAIDI trends on targeted feeders
- SAIFI trends where fault indicator data supports maintenance and sectionalizing changes
- Number of recurring faults by feeder section
The best approach is to start with feeders where fault location is slow, outage duration is high, or customer impact is significant. After deployment, the utility can compare event logs, OMS records, crew reports, and reliability metrics.
What Fault Indicators Cannot Do
Fault indicators are useful, but they are not a complete reliability solution by themselves. They do not remove vegetation, repair aging assets, prevent lightning, or replace proper protection coordination.
They also need correct settings and suitable application. A poorly selected or incorrectly configured device can create false indications or miss some fault conditions. Grounding method, load current, fault current level, feeder design, and communication coverage all matter.
Balanced View
A fault indicator is most effective when it is part of a wider reliability strategy that includes protection coordination, maintenance planning, vegetation management, automation, switching, and clear crew procedures.
Conclusion
Fault indicators can help utilities improve reliability by making outages easier to locate and manage. Their strongest direct impact is on SAIDI, because faster fault location and dispatch can reduce outage duration. They can also support SAIFI improvement when their data is used for recurring fault analysis, better sectionalizing, and distribution automation.
For overhead distribution networks, a well-planned line fault sensor or line fault indicator deployment can reduce manual patrols, improve crew dispatch, support SCADA and OMS workflows, and help operators restore power more efficiently.
The key is to treat fault indicators as part of a complete reliability program. When they are properly placed, integrated, and used in daily operations, they give utilities the visibility needed to reduce outage impact and improve customer experience.
Looking to improve feeder reliability? Start with outage history, fault location time, crew patrol routes, and the sections where better line visibility can deliver the fastest operational impact.